
Americans Are Saving 3.8% of Their Paychecks. Here Is How to Check Yours
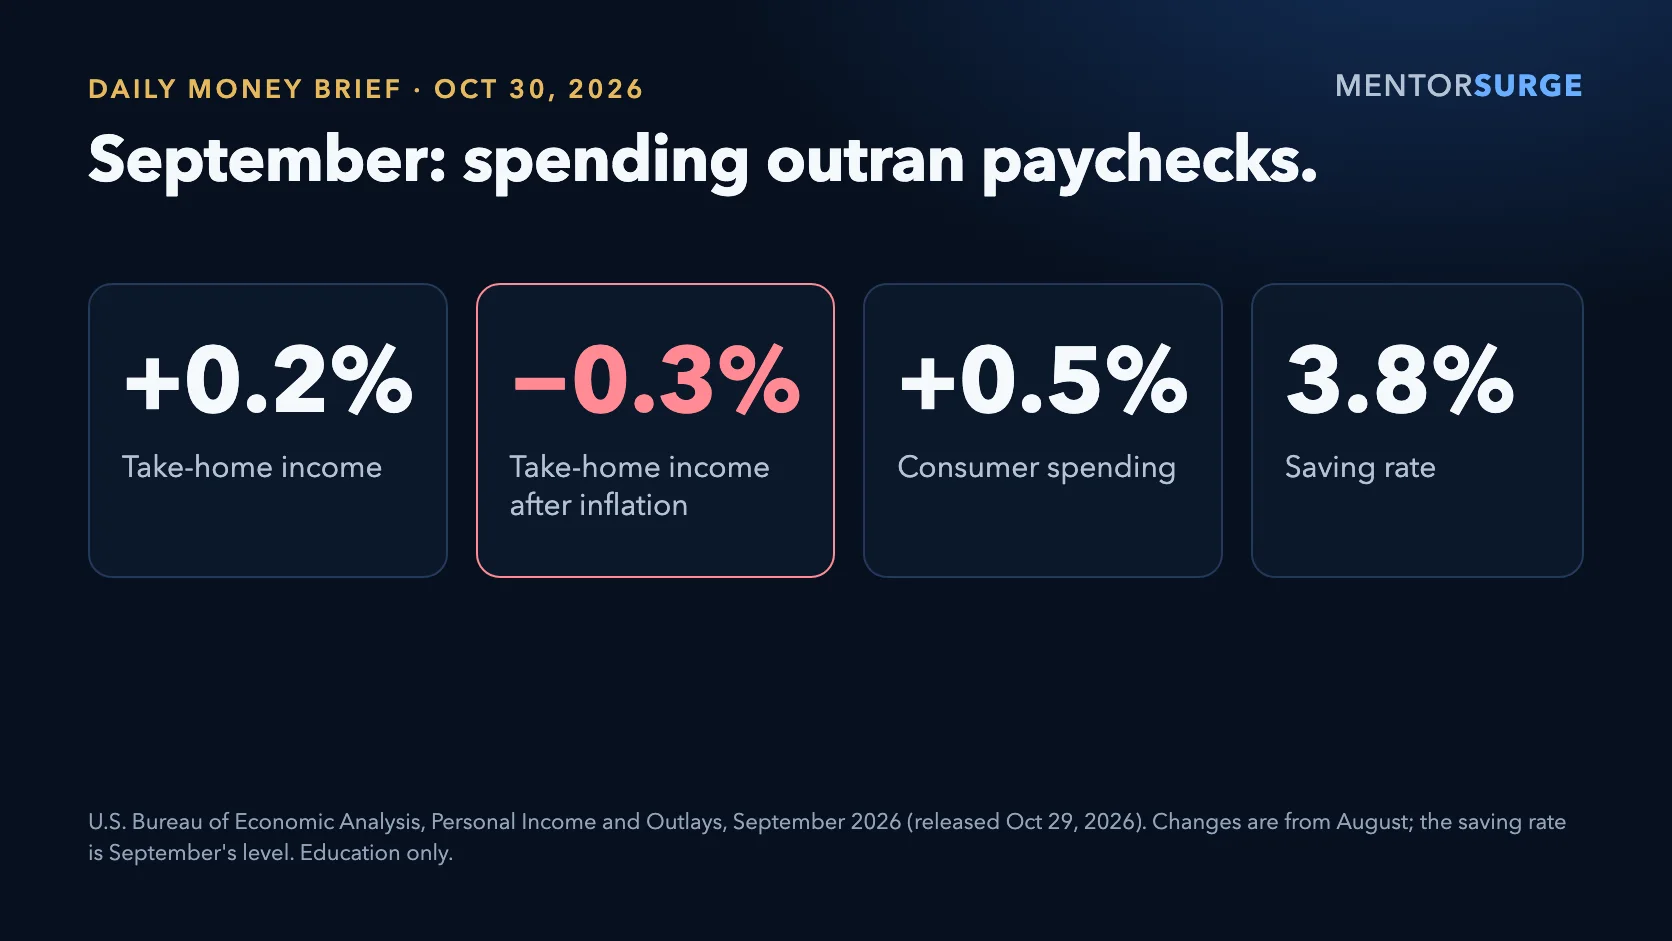
In September, spending grew faster than paychecks and prices rose 3.6% from a year ago. The country kept about 3.8 cents of every after-tax dollar. Here is how to find your own number.

Figures from the U.S. Bureau of Economic Analysis report released October 29, 2026, covering September 2026. Checked October 30, 2026.
The number
That is the share of after-tax income Americans saved in September, according to the Bureau of Economic Analysis. Put another way, about 3.8 cents of every dollar of take-home pay. Read the September report.
What happened in September
| Measure | Change | Period |
|---|---|---|
| Take-home (after-tax) income | +0.2% | From August |
| Take-home income, after inflation | −0.3% | From August |
| Consumer spending | +0.5% | From August |
| Prices (PCE price index) | +0.5% | From August |
| Prices (PCE price index) | +3.6% | From September 2025 |
| Prices excluding food and energy | +3.1% | From September 2025 |
Source: BEA Personal Income and Outlays, September 2026, released October 29, 2026. Monthly changes are seasonally adjusted and may be revised.
Put simply: paychecks grew a little, prices grew faster, and people kept spending. Spending and other outlays rose $113.0 billion in the month while after-tax income rose $52.7 billion, so the amount saved fell by about $60 billion.
What it means for your budget
A national average hides a lot. Some households save far more than 3.8%, and some spend more than they earn. The direction is what matters: when prices rise faster than pay, the same habits leave less at the end of the month, even if nothing about your spending feels different.
When spending grows faster than income for long, the gap gets covered by savings or by borrowing. Neither can last forever. That is why the saving rate is worth watching, both for the country and in your own accounts.
At 3.8%, someone taking home $4,000 a month saves about $152. At that pace, a $1,000 starter emergency fund takes about seven months ($1,000 ÷ $152 = 6.6).
One thing to do this week
- Add up last month’s take-home pay: the amount that actually landed in your account.
- Add up last month’s spending: bills, card payments, cash and everything else that left. Leave out money you moved into savings.
- Subtract spending from take-home pay, then divide by take-home pay. That is your saving rate.
Example: $4,000 in, $3,700 out. $300 ÷ $4,000 = 7.5%. If your answer is negative, that is the most useful number you can know this month, and the cash-flow calendar lesson shows where the money goes week by week.
Go deeper
- Build a Starter Emergency Fund: what to aim for first, and where to keep it.
- Map Your Cash Flow Before You Budget: when money arrives and when it leaves.
- Wednesday’s brief: what the Fed’s hold means for your card and savings rates.
What comes next
BEA’s next report, covering October, is scheduled for November 25, 2026 (BEA). Nobody knows what it will show, and this brief makes no forecast. What you can know before then is your own saving rate.
Your next step: work out your saving rate with last month’s numbers, then take the starter emergency fund lesson. Together they take about 20 minutes.
Educational commentary only, not individualized investment, tax, or legal advice. National figures are averages and estimates that may be revised; your own numbers will differ. Examples are illustrations.