
MARKETS · STOCK RESEARCH
AMD Stock Analysis 2026: AI Growth, Fair Value and Price Levels
AMD's AI opportunity is expanding, but its stock already assumes substantial execution. This deep dive tests the earnings case, cash-flow value and per-share risks.

Reader note: AMD can move sharply. The price ranges below are dated research scenarios, not trading instructions.
Research date: October 16, 2026. Market reference: AMD at $535.77 at 1:43:13 p.m. Eastern on October 16, 2026, from Financial Modeling Prep. This is an intraday quote, not the closing price. All amounts are U.S. dollars.
AMD has a credible path to becoming a much larger and more profitable company. The harder question is how much of that success its stock already assumes.
At roughly $536, the investment case depends on years of execution. A strong quarter or another AI partnership is helpful, but the valuation ultimately needs substantial earnings growth, durable cash generation and enough value left for each shareholder after dilution.
This analysis reaches a qualified conclusion: AMD’s operating momentum supports a serious long-term thesis, while the current share price leaves a limited cushion under a generous earnings-based base case. A more demanding cash-flow model produces a materially lower value. That disagreement is central to understanding the stock.
The framework below separates reported results, management targets and independent assumptions. The proposed price zones are fundamental valuation ranges, not technical support levels or trade instructions.
The latest reported numbers
AMD’s latest reported quarter is Q2 2026, ended June 27. Q3 results are scheduled for November 3, 2026, after the market closes. Q3 figures discussed here are guidance, not reported results. AMD earnings calendar
| Metric | Q2 2026 reported |
|---|---|
| Revenue | $11.536 billion |
| Revenue growth | 50% year over year |
| GAAP gross margin | 54% |
| Non-GAAP gross margin | 56% |
| GAAP operating income | $1.990 billion |
| Non-GAAP operating income | $3.094 billion |
| GAAP diluted EPS | $1.38 |
| Non-GAAP diluted EPS | $1.66 |
For Q3, management guided to revenue of $13.0 billion, plus or minus $300 million, and approximately 56% non-GAAP gross margin. AMD Q2 earnings release
The important question now is whether AMD can turn a larger revenue base into sustained per-share earnings and cash flow. A business can clear its near-term guidance while still falling short of the growth embedded in its share price.
Understanding the business behind the AI headline
AMD has three reporting segments. Q2 Data Center revenue was approximately $6.7 billion, up 107% year over year. Client and Gaming produced approximately $3.8 billion, up 6%, while Embedded generated $977 million, up 19%. Within Client and Gaming, the client business grew 23%, while gaming fell 31%. Q2 earnings materials
These businesses have different economic drivers.
Data Center contains EPYC server CPUs as well as Instinct accelerators. Its growth cannot be treated as a disclosed GPU revenue number. The financial statements do not provide a clean quarterly split that lets an outside investor independently calculate Instinct’s stand-alone revenue and profit contribution.
That distinction matters. CPU share gains, GPU adoption and changes in product mix can all increase Data Center sales, but they imply different competitive risks and future margins.
EPYC gives AMD an additional route into cloud and enterprise spending. An AI buildout also needs general-purpose compute for data preparation, databases, orchestration and application workloads. AMD can benefit even when a customer’s accelerator fleet contains competing hardware. The extent of that benefit remains something to measure rather than assume.
Client processors offer another source of growth, but PC demand still depends on replacement cycles, corporate budgets and consumer spending. AI features need to create a purchase incentive or a richer product mix to become an earnings catalyst.
Gaming remains exposed to console cycles and discretionary purchases. Embedded can provide valuable diversification, although customer inventory adjustments and industrial demand can make its recovery uneven.
The practical takeaway is to model the businesses separately enough to understand the drivers, while avoiding precision that AMD’s disclosures do not support. This article’s valuation uses consolidated revenue and margins; it does not invent a historical AI GPU revenue series.
For a view of the software layer of AI infrastructure, read the MentorSurge Palantir research note. The chip, software and cloud layers have different economics.
The AI opportunity is real, but gigawatts are not revenue
The customer announcements make AMD’s opportunity more tangible:
- OpenAI’s October 2025 agreement covered deployment of six gigawatts across multiple generations of AMD GPUs. OpenAI agreement announcement
- Meta’s February 2026 agreement covered up to six gigawatts, with shipments supporting the first gigawatt expected to begin in the second half of 2026. Meta agreement announcement
- Anthropic’s July 2026 partnership contemplated up to two gigawatts, with the first gigawatt beginning in the first half of 2027. AMD also committed to an equity investment of up to $5 billion in Anthropic. Anthropic partnership
These arrangements strengthen the case that major buyers want AMD in their infrastructure. They do not justify adding the gigawatt figures together and applying a fixed dollars-per-gigawatt multiplier to produce guaranteed revenue.
Power capacity is not an accounting measure. Revenue depends on the hardware mix, pricing, delivery schedule, customer acceptance and which parts of a system AMD actually sells. Customer deployment plans also depend on financing, data-center readiness and available power.
The right sequence to watch is straightforward: announced capacity, qualified systems, delivered products, recognized revenue, collected cash and repeat orders. Each step provides stronger evidence than the one before it.
Investors should also examine the capital AMD commits alongside commercial relationships. An equity investment may create value, but it ties up capital and adds exposure to the customer’s economics. It is reasonable to evaluate the hardware sales and the investment separately before concluding that the overall arrangement is attractive.

Software and rack-level execution will determine the moat
A powerful accelerator is only one component of a successful AI platform. Customers care about useful work completed at an acceptable cost, including software support, networking, memory, reliability, power and engineering time.
AMD’s ROCm strategy and broader systems effort aim to reduce the cost of adopting its hardware. The investment question is whether customers can deploy important workloads repeatedly without disproportionate custom engineering. Evidence of production adoption and repeat purchasing is more persuasive than download counts or a favorable benchmark alone.
The competitive bar is substantial. NVIDIA reported $89.0 billion of Data Center revenue and 75.0% company gross margin for its quarter ended July 26, 2026. Its segment definitions and product mix differ from AMD’s, so these numbers do not establish a precise market-share comparison. They do illustrate the scale of the incumbent AMD faces. NVIDIA Q2 fiscal 2027 results
Competition also includes customers’ own silicon. AWS has made Trainium3-based EC2 Trn3 UltraServers generally available. That is a reminder that additional AI spending does not automatically flow to merchant GPU vendors. AWS Trainium3 announcement
AMD can build a valuable business without replacing the market leader. It needs enough profitable workloads, repeat demand and engineering leverage to support its valuation. A second-source position can be commercially useful, but it does not by itself guarantee attractive pricing power.
Recent announcements add opportunity and execution risk
On October 12, AMD introduced Helion, an agentic-AI rack blueprint with flexible CPU and GPU configurations. Partner configurations were planned for November 2026 availability. Helion is distinct from the Helios rack-scale platform; the similar names should not be confused. The announcement expands AMD’s addressable workloads, but it is too early to assign a separate stream of profits to it. AMD Helion announcement
AMD also announced a definitive agreement to acquire World Labs for approximately $8.2 billion in stock, with closing expected by the end of 2026 subject to conditions. The strategic rationale is deeper AI-model expertise; the investment test is whether that expertise improves products and returns enough to justify the consideration and integration effort. The announcement is not evidence that the acquisition has already closed. World Labs agreement
Similarly, the August 6 Taalas release describes an acquisition agreement subject to closing conditions. Its specialized inference technology may broaden AMD’s capabilities, but the release alone does not establish completion or quantify future earnings. Taalas agreement
The model below does not assign stand-alone acquisition synergies. That avoids paying for the same AI opportunity several times through overlapping product narratives.
Earnings quality deserves a closer look
Non-GAAP results help explain AMD’s underlying operations, but the adjustments are economically different.
In Q2, the bridge from $2.297 billion of GAAP net income to $2.760 billion of non-GAAP net income included adding back $503 million of stock compensation and $544 million of acquired-intangible amortization, while removing $483 million of investment gains, alongside other adjustments. The prior-year quarter included an $800 million export-related inventory charge and a substantial tax-reserve release. AMD reconciliation
This is why the headline EPS growth rate needs context. Some of the improvement reflects a weak comparison, and some reported profit comes from items outside ordinary chip sales.
Acquired-intangible amortization is noncash in the current period. Excluding it can make operating comparisons more useful, but acquisitions still consumed cash or shares. Repeated acquisitions should not be treated as costless simply because their amortization is adjusted out.
Stock compensation is different again. It is a recurring transfer of value to employees. Shareholders bear the cost through dilution or the cash required to offset it with repurchases.
For valuation, this analysis therefore shows both an adjusted-EPS approach and a cash-flow approach that treats recurring stock compensation as an economic expense. Neither GAAP EPS nor adjusted EPS should be used mechanically on its own.
Cash flow is growing, but conversion matters
Q2 continuing operating cash flow was $2.366 billion. After $808 million of capital expenditure, AMD-defined free cash flow was $1.558 billion. That was below the quarter’s adjusted net income. AMD cash-flow reconciliation
For full-year 2025, continuing operating cash flow was $6.493 billion and capex was $974 million, producing $5.519 billion of comparable free cash flow. Total operating cash flow also included discontinued ZT manufacturing operations, so using that total would overstate the comparable figure. FY2025 results and cash-flow tables
Combining that full-year figure with the first-half 2026 and 2025 periods produces approximately $7.736 billion of trailing free cash flow through June 2026. At the quote provider’s approximately $874.6 billion market capitalization, the trailing FCF yield is about 0.88%. This is a derived historical measure, not an estimate of next year’s yield. Cash-flow periods in AMD’s filing
Fast growth can require inventory, supplier prepayments and customer receivables before cash is collected. Payables can also temporarily support operating cash flow. The useful test is whether cash conversion strengthens across several quarters as deployments scale, after allowing for the investment needed to deliver them.
The balance sheet is more complicated than net cash
At June 27, AMD held $13.111 billion of cash and short-term investments against $3.250 billion of debt principal. The same filing disclosed $30.276 billion of unconditional purchase and cloud-related commitments, $4.5 billion of uncommenced leases, and subsequent leases with $9.5 billion of future payments. It also disclosed maximum contingent lease guarantees of $4.1 billion. These categories differ in timing and conditionality and should not be added together as if they were current debt. Q2 Form 10-Q, commitments and liquidity
There is an important subsequent event: AMD closed a $4.75 billion senior-note offering on August 17. Consequently, June’s cash and debt balances are historical reference points, not a verified October liquidity snapshot. August debt offering filing
Borrowing adds both cash and debt at issuance, before fees. It does not automatically reduce net cash by the face amount. Spending the proceeds, investment commitments and additional operating obligations can change that position later.
AMD retains financial flexibility, but scaling AI infrastructure can require more capital and contractual support than the simplest fabless-chip model suggests. That deserves a place in valuation assumptions.
Dilution is part of the price paid for growth
Q2 diluted weighted-average shares were 1.659 billion. That figure is not a complete count of all potential future shares. AMD’s OpenAI and Meta warrants each cover up to 160 million shares, subject to milestones and conditions. None had vested or become exercisable as of June 27. Q2 Form 10-Q, equity and warrants
For a conservative dilution stress, this analysis uses 2.0 billion shares: approximately the reported quarterly diluted base, the full 320 million warrant shares, and an indicative allowance for World Labs stock consideration. The allowance is not a forecast of the acquisition’s actual exchange ratio.
Applying full warrant dilution even to the bear case is deliberately conservative because weak commercial performance may prevent some vesting. Conversely, actual future shares could exceed this assumption through employee awards, acquisitions or other issuance.
At a fixed earnings pool, increasing the denominator from 1.659 billion to 2.0 billion reduces EPS by approximately 17%. A further 5% increase in shares reduces per-share value by approximately 4.8%.
Warrant accounting can also affect reported revenue and earnings. These illustrative operating scenarios do not attempt to forecast unknown future noncash warrant charges or remeasurement gains and losses. Their dilution cost is reflected in the share denominator; they are not GAAP earnings forecasts or reconciliations to AMD’s future non-GAAP reporting. Warrant accounting disclosure
What management’s long-term targets actually mean
At its November 2025 analyst day, AMD outlined targets for the next three to five years: more than 35% revenue CAGR, more than 35% non-GAAP operating margin and annual non-GAAP EPS above $20. It also targeted more than 60% Data Center revenue CAGR and more than 80% Data Center AI revenue CAGR. These are management’s forward-looking ambitions, not achieved results or a promise of $20 EPS in a specific calendar year. AMD financial analyst day targets
A useful valuation needs to specify when earnings arrive and what investors will pay for them. Multiplying a distant EPS target by today’s preferred multiple skips the return required during the wait.
A reproducible bear, base and bull valuation
The following scenarios value the shares at December 31, 2029, then discount those values back to October 16, 2026. The horizon is approximately 3.21 years. The 12% annual hurdle rate is an analytical choice, not a measured company cost of capital.
All figures below are independent assumptions. Revenue is an illustrative operating measure before unquantified future noncash warrant-accounting effects. Operating margins and EPS follow an adjusted convention that excludes stock compensation and acquired-intangible amortization; recurring compensation is addressed separately in the cash-flow model.
| 2029 assumption or output | Bear | Base | Bull |
|---|---|---|---|
| Revenue | $88B | $145B | $205B |
| Adjusted operating margin | 23% | 35% | 39% |
| Net interest expense | $0.3B | $0.3B | $0.3B |
| Tax rate | 17% | 15% | 13% |
| Modeled shares | 2.0B | 2.0B | 2.0B |
| Calculated adjusted EPS | $8.28 | $21.44 | $34.65 |
| Exit P/E | 25x | 35x | 40x |
| End-2029 scenario price | $207 | $750 | $1,386 |
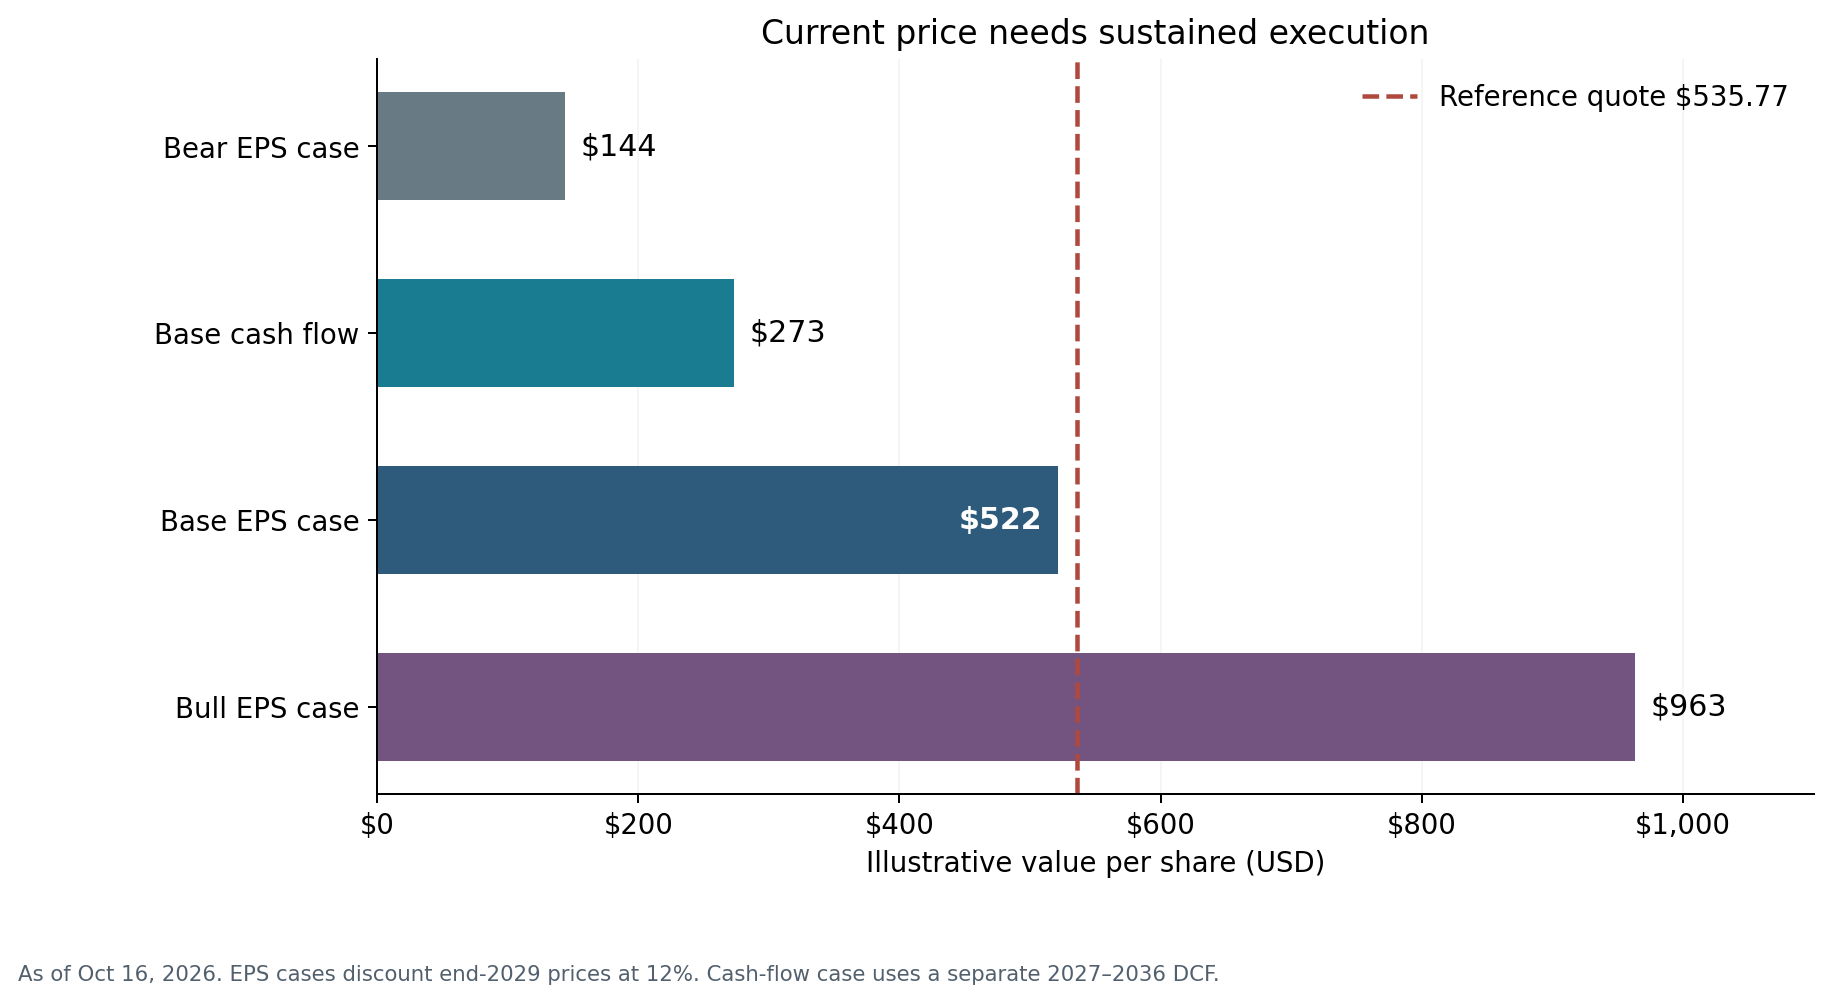
| Present value at 12% | $144 | $522 | $963 |
| Annualized price return from $535.77 | −25.7% | 11.1% | 34.5% |
The formula is:
Adjusted EPS = [(revenue × operating margin − net interest expense) × (1 − tax rate)] ÷ modeled shares.
Present value = [adjusted EPS × exit P/E] ÷ 1.12^3.208761.
No probability weights are assigned because there is insufficient evidence to estimate them reliably. These are conditional outcomes, not statistical confidence intervals or guaranteed upside and downside limits. Returns exclude dividends, transaction costs and personal taxes.
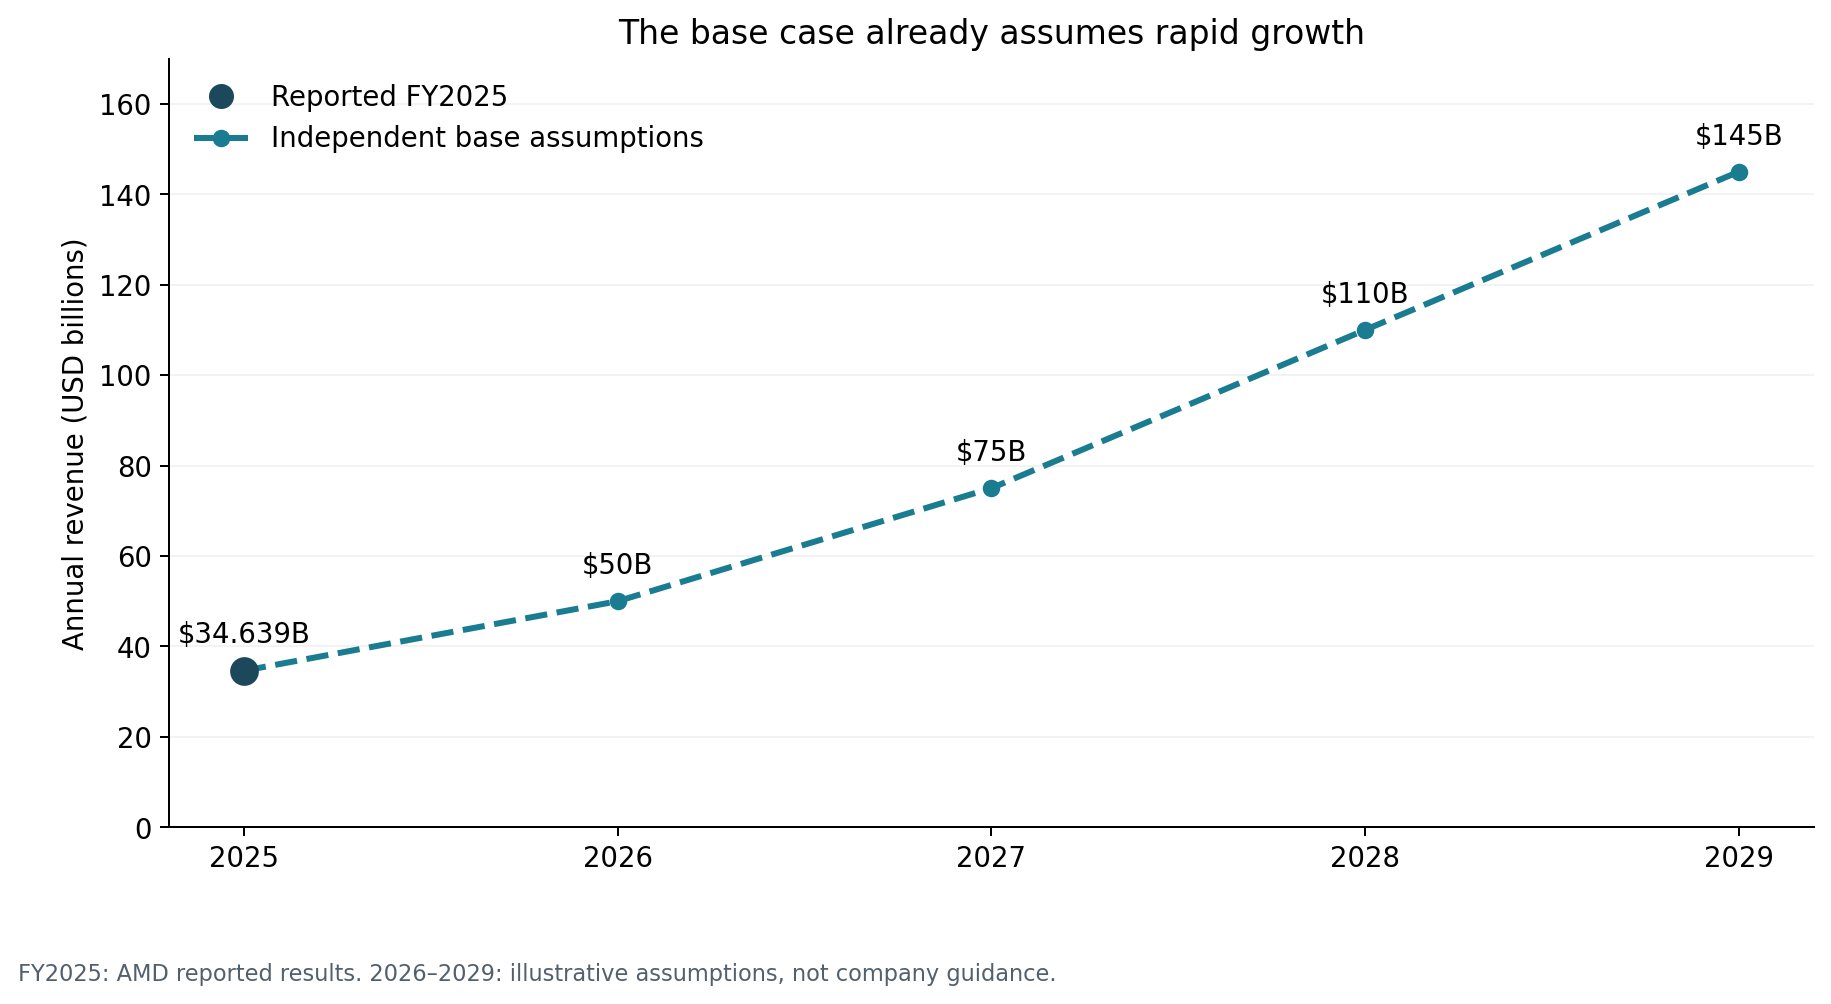
The base case is already ambitious. Revenue grows from $34.639 billion in FY2025 to $145 billion in 2029, approximately 43% annually. It assumes a 35% adjusted operating margin and retains a 35x earnings multiple at the end of the period. Calling this the base case does not make it conservative. The 2.0 billion share assumption does not separately forecast additional future net employee issuance; the share-count sensitivity shows how that could affect the result.
The bear case allows AMD to become substantially larger while competition, investment requirements or weaker pricing limit profitability. Its result shows how a growing business can still produce a poor stock return.
The bull case requires exceptional execution and a premium multiple. It is possible to describe that outcome coherently without treating it as the expected result.
What the current price requires
At $535.77, earning 12% annually to the end of 2029 requires a future price of approximately $771. At a 35x exit multiple, that means approximately $22.02 of EPS. Under the base-case tax, share and interest assumptions, revenue would need to reach roughly $149 billion at a 35% operating margin.
That is close to the base operating case. The problem is the limited cushion: a lower margin, more shares, a later ramp or a lower exit multiple can reduce the return materially.
| 2029 EPS | 25x P/E | 30x P/E | 35x P/E | 40x P/E |
|---|---|---|---|---|
| $10 | $174 | $209 | $243 | $278 |
| $15 | $261 | $313 | $365 | $417 |
| $20 | $348 | $417 | $487 | $556 |
| $25 | $434 | $521 | $608 | $695 |
| $30 | $521 | $626 | $730 | $834 |
Cells are October 16, 2026 present values discounted at 12%, not end-2029 prices. They are calculated independently of the three scenarios.

The cash-flow cross-check gives a tougher answer
An earnings multiple can capitalize growth generously. A discounted cash-flow model asks how much cash the business can produce after the costs required to sustain it.
The independent base cash-flow model assumes revenue of $75 billion in 2027, $110 billion in 2028 and $145 billion in 2029, rising to $276 billion in 2036. The 2026 starting revenue assumption is $50 billion, not management’s full-year guidance. It combines actual first-half sales and Q3 guidance with an assumed fourth quarter.
Adjusted operating margin rises from 30% in 2027 to 36% from 2030. Recurring stock compensation is charged as an economic expense, falling from 4% of revenue to 3%. Cash taxes are 15%, capex 2% of sales, non-acquisition depreciation 1%, and incremental working capital 12% of incremental revenue.
That produces modeled economic unlevered free cash flow of approximately $12.8 billion in 2027, $22.3 billion in 2028, $33.8 billion in 2029 and $73.3 billion in 2036. These are model outputs, not AMD guidance, and are not directly comparable to reported FCF without the stated adjustments.
At a 12% discount rate and 4% perpetual growth, the model produces approximately $273 per share. It uses 2.0 billion shares and the historical June net-cash reference of $9.861 billion as a bridge, rather than claiming to know October cash. Every $5 billion change in that bridge changes value by $2.50 per share. Cash flows are placed at calendar year-end with actual-day discounting. No separate October-to-December 2026 cash flow is included. Recurring SBC is charged economically, so additional employee dilution is not also layered into this DCF.
| Model year | Revenue | Adjusted operating margin | SBC as % of revenue | Economic FCF |
|---|---|---|---|---|
| 2027 | $75B | 30% | 4.0% | $12.83B |
| 2028 | $110B | 33% | 3.5% | $22.28B |
| 2029 | $145B | 35% | 3.0% | $33.79B |
| 2030 | $174B | 36% | 3.0% | $43.59B |
| 2031 | $200B | 36% | 3.0% | $50.98B |
| 2032 | $220B | 36% | 3.0% | $57.11B |
| 2033 | $238B | 36% | 3.0% | $62.22B |
| 2034 | $252B | 36% | 3.0% | $66.49B |
| 2035 | $265B | 36% | 3.0% | $70.12B |
| 2036 | $276B | 36% | 3.0% | $73.34B |
Economic FCF = revenue × (adjusted operating margin − SBC margin) × (1 − cash tax rate) + non-acquisition depreciation − capex − incremental working capital. The terminal year applies the same mature margins and reinvestment rules to revenue growing at the selected perpetual rate. About 56% of the central enterprise value comes from the discounted terminal value.
Each discount exponent equals the number of days from October 16, 2026 to that year’s December 31, divided by 365.25. Terminal value at the end of 2036 equals 2037 economic FCF divided by (discount rate − perpetual growth rate). The supplied model contains the full unrounded calculations.
| Discount rate | 3% terminal growth | 4% terminal growth | 5% terminal growth |
|---|---|---|---|
| 10% | $342 | $378 | $427 |
| 11% | $294 | $318 | $350 |
| 12% | $256 | $273 | $296 |
| 13% | $226 | $239 | $255 |
| 14% | $202 | $212 | $223 |
The 5% perpetual-growth column is an aggressive sensitivity, not a default assumption. The model does not deduct all contractual commitments as debt; ordinary delivery costs and reinvestment are represented in the operating assumptions. It also does not separately price unspecified acquisition synergies or value strategic investments at an assumed future gain.
Why is this below the $522 EPS-based present value? The cash-flow model charges recurring stock compensation, funds growth and assumes a mature growth rate after 2036. The earnings method retains a premium 2029 multiple. Those methods embed different views of how long exceptional economics will last.
Averaging the two would conceal that disagreement. At a 12% discount rate and 4% perpetual growth, today’s quote requires approximately 1.98 times the model’s future cash flows, holding the cash bridge and share count constant. Alternatively, the unchanged cash-flow path reaches the quote at an approximately 8.36% discount rate. Those are backsolves, not forecasts.
For more on why the discount rate matters, see Mentor Surge’s discussion of inflation, higher rates and portfolio valuations.
To study price and volume separately, open MentorSurge Stock Charts and search AMD. The Market Dashboard provides broader ETF market context. Market data can be delayed or unavailable.
A proposed AMD price structure
These zones are rounded decision aids derived from the models above. They are fundamental valuation ranges, not technical support levels or instructions to place trades.
- Below $250: More room against the $273 base DCF, provided the operating thesis remains intact. A falling price caused by a broken thesis would require a new model.
- $250 to $350: Around the cash-flow model’s central value and sensitivities. The long-term earnings case offers a larger potential cushion, but execution risk remains substantial.
- $350 to $450: Requires more confidence in sustained growth or a lower required return than the central DCF assumes. Under the $750 end-2029 earnings case, entry at $400 implies approximately 21.7% annualized appreciation.
- $450 to $550: Close to the generous earnings-based base valuation. Entry at $500 implies about 13.5% annually to that outcome; the $535.77 reference price implies about 11.1%.
- Above $550: Requires stronger earnings, a richer future multiple or a lower return hurdle to improve the case. At $650, the same $750 end-2029 result yields approximately 4.6% annually.
There is no single price at which AMD becomes safe. These ranges should move when the evidence changes. A better margin profile can raise value; a delayed ramp, more capital intensity or additional dilution can lower it.
What would strengthen or break the thesis
The next earnings release matters most for the evidence it adds to the multiyear path.
| Evidence to monitor | Stronger thesis | Reason to reconsider |
|---|---|---|
| Deployment conversion | Announced programs become delivered, accepted systems and repeat orders | Repeated delivery or acceptance delays |
| Data Center economics | Revenue growth produces durable operating leverage | Sales rise while margin progress stalls |
| Cash conversion | Cash generation improves after required investment | Persistent receivable, inventory or prepayment absorption |
| Software adoption | More production workloads run with repeatable deployment economics | Wins depend on heavy bespoke engineering or concessions |
| Per-share economics | Earnings and economic cash flow outgrow dilution | More issuance or customer incentives absorb the growth |
| Customer funding and power | Projects advance with adequate financing and infrastructure | Spending plans outrun funding or site readiness |
These are analytical tests, not claims that a specific problem has already occurred.
The largest downside risk is a combination of slower growth and multiple compression. Export restrictions, supply constraints, competing platforms, customer concentration and semiconductor cyclicality can affect the operating result. A premium valuation can magnify the stock-price response. AMD’s annual filing describes these risks in greater detail. AMD FY2025 annual filing
The next confirmed catalyst is the November 3 Q3 report. Management’s Q4 outlook, cash conversion and evidence of deployment progress should be more useful than assuming that a revenue beat alone settles the valuation question.
AMD stock questions investors should ask
Is AMD a pure AI GPU investment?
No. It has server CPU, PC, gaming and embedded businesses as well as AI accelerators. Data Center reporting combines several products, so the segment’s growth should not be relabeled as disclosed GPU growth.
Does AMD need to beat NVIDIA to create value?
It needs enough profitable demand to justify its own price. A valuable market position is possible without overall market leadership, but customers’ desire for an alternative supplier does not guarantee AMD’s margins.
Is the $20 EPS target enough to justify the current price?
It depends on timing, dilution and the future multiple. At 35x, $20 EPS implies $700 at that future date. Discounted from the end of 2029 at 12%, that is about $487 today. The date is an assumption in this example, not AMD’s promise.
Why not value AMD using revenue alone?
Revenue does not capture margins, working capital, compensation costs, contractual obligations or share dilution. Those differences become especially important when a company expands from components toward broader systems and commercial partnerships.
Bottom line
AMD’s opportunity is large enough to support an ambitious investment thesis. Its latest results also show that the opportunity is becoming a larger operating business.
At roughly $536, however, shareholders are already paying for substantial progress. The illustrative earnings base case can support a value near the current quote, but it requires rapid growth, major margin expansion and a premium future multiple. The economic cash-flow cross-check demands considerably more caution.
The most useful question is therefore specific: can AMD deliver enough durable cash and earnings per share, after the capital and dilution needed to grow, to beat the return available elsewhere? That is the question the next several years must answer.
Follow @mentor_surge on Instagram for more market research and visual breakdowns.
Sources checked
- AMD Q2 2026 release, August 4, 2026
- AMD Q2 2026 Form 10-Q, August 5, 2026
- Q2 earnings slides, HTML exhibit
- AMD FY2025 release, February 3, 2026
- FY2025 annual filing
- FY2025 amended filing
- August 17 senior-notes closing
- OpenAI agreement, October 6, 2025
- Meta agreement, February 24, 2026
- Anthropic partnership, July 22, 2026
- Financial analyst day targets, November 11, 2025
- Helion announcement, October 12, 2026
- World Labs agreement, September 28, 2026
- Taalas agreement, August 6, 2026
- Q3 2025 warrant accounting disclosure
- Q3 earnings date confirmation, October 6, 2026
- NVIDIA Q2 fiscal 2027 results, August 26, 2026
- AWS Trainium3 availability announcement
This article is educational research, not individualized investment advice. Valuation outputs depend on assumptions and can change materially. Readers should assess their own risk tolerance and verify current prices and filings.
Join the MentorSurge Community
Occasional emails with new lessons, market explainers, and selected articles.
Prefer real time takes? Follow @mentor_surge on Instagram