
INTC Stock: What Intel’s Turnaround Still Needs to Prove
INTC stock analysis: Intel’s stronger earnings, foundry economics, cash flow, and dilution after its expanded share offering—plus what to watch next.
Research checked through September 7, 2026. All financial figures are in U.S. dollars.
Intel’s latest quarter gives the turnaround story something more useful than another presentation: stronger sales and better operating margins. That is a reason to pay attention. It is not a reason to stop asking difficult questions.
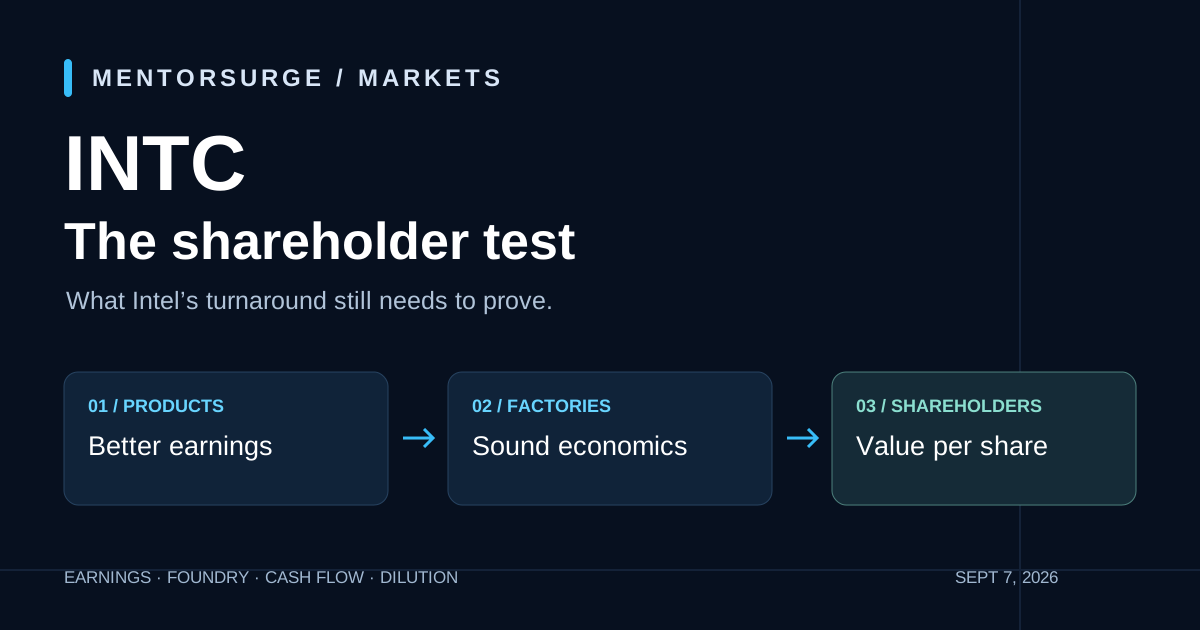
For anyone researching INTC stock, the job is to separate three things: the health of the chip business, the economics of the factories, and the value ultimately left for each shareholder. Those can improve at different speeds.
This is a business-and-risk breakdown, not a price target or a claim that Intel is cheap. The question is whether the evidence supports a durable recovery—and what would tell us otherwise.
1. The earnings improvement is worth taking seriously
Intel reported the following results for its quarter ended June 27, 2026:
| Metric | Q2 2026 | Q2 2025 |
|---|---|---|
| Revenue | $16.1 billion | $12.9 billion |
| GAAP gross margin | 40.4% | 27.5% |
| GAAP operating margin | 11.1% | −24.7% |
| GAAP diluted EPS | −$2.16 | −$0.67 |
| Non-GAAP diluted EPS | $0.42 | −$0.10 |
Data Center and AI revenue increased 59% to roughly $6.3 billion. These are reported results, not projections. Intel’s Q2 earnings release.
The gap between operating profit and the bottom-line loss needs explaining. Intel recorded a $12.529 billion non-cash mark-to-market loss on its Escrowed Shares derivative liability, covering shares released during Q2 and those still in escrow at quarter-end. That was the dominant adjustment between GAAP and non-GAAP net income. Intel’s Q2 reconciliation.
My read: neither EPS figure is a complete investment thesis. The reported loss does not mean the operating business lost the same amount. The adjusted profit does not make the excluded items irrelevant. Start with how the products make money, then examine the accounting and ownership obligations around them.
2. Foundry revenue needs a closer look
Intel Foundry reported $5.765 billion of quarterly segment revenue, but only $293 million came from external customers. Most of the segment’s revenue was internal. Intel also says the external increase primarily reflected Altera becoming an external customer after its deconsolidation—not simply a wave of new customer wins. Intel’s Q2 Form 10-Q, Note 2 and Foundry discussion.
That distinction matters. Manufacturing Intel’s own chips can demonstrate technical progress. Winning repeat, profitable orders from independent customers demonstrates something additional: a competitive manufacturing service.
Foundry’s quarterly operating loss narrowed to $2.089 billion from $3.168 billion. However, Intel attributed the improvement primarily to lower period charges; higher-cost 18A wafers weighed on product profit. A smaller loss is encouraging, but it is not yet proof of attractive factory economics. Intel’s Q2 Foundry results.
Where 18A-P fits
In June, Intel announced that 18A-P had entered risk production. It also described design compatibility with 18A and performance and power improvements. Those are company-reported engineering milestones, not a disclosure of profitable external production at scale. Intel’s VLSI process update.
The practical test is repeatability. Can a customer move from a promising design to reliable deliveries, acceptable costs, and another order? A roadmap is useful because it tells us what management intends to build. Commercial results tell us whether customers want it enough to pay.
3. Read the cash-flow bridge, not just the headline
Intel generated $7.006 billion in operating cash flow during Q2. Its own non-GAAP adjusted free cash flow was negative $8.419 billion. The reconciliation included $2.652 billion of gross capital spending and a negative $12.216 billion net partner-contribution line, alongside incentives and finance-lease payments. Intel’s cash-flow reconciliation.
There is important transaction context. On April 8, Intel repurchased Apollo’s 49% interest in the Fab 34 joint venture in Ireland for $14.2 billion. That restored full ownership of the venture and involved a major cash outlay; it was not simply the recurring cost of making chips. Intel’s April 8 transaction filing.
Two shortcuts would mislead here. Looking only at operating cash flow overlooks large uses of capital. Treating the adjusted free-cash-flow deficit as a normal quarterly operating burn overlooks the ownership transaction.
For future reports, keep recurring operations, factory investment, and partner transactions separate. Then ask whether the business can increasingly finance its own growth. That is a more useful test than choosing whichever cash-flow measure supports the position you already want to take.
4. The share offering changes the shareholder question
Intel’s August financing grew beyond the initial $20 billion headline. Intel agreed to issue 210,526,315 shares at $95, and the underwriters exercised their full 31,578,947-share option on August 11. That brought the offering to 242,105,262 shares—approximately $23 billion gross, calculated before fees. The $95 offering price is not a current quote or a valuation target. Intel’s August 12 offering filing.
Intel identified general corporate purposes, potentially including capital expenditures and working capital, as intended uses of the proceeds. Intel’s offering announcement.
Fresh equity can fund productive capacity and reduce financing pressure. It also increases the number of shares participating in future earnings. Whether the trade-off creates value depends on the return Intel earns on the new capital.
That is why “Intel is improving” and “INTC is attractively valued” are different claims. A valuation needs a sustainable earnings or cash-flow estimate, the relevant share count, and an honest allowance for execution risk. Annualizing one adjusted quarter or anchoring to an old share price does not supply those inputs.
The question to keep asking is simple: does the recovery improve economics per share, or mainly make the company bigger?
5. What would strengthen—or weaken—the case?
This is the scorecard I would use for the next few reports. It is an analytical framework, not management guidance or a prediction.
| Watch item | Evidence that strengthens the case | Evidence that weakens it |
|---|---|---|
| Product business | Sales growth accompanied by durable margins | Growth that requires persistent margin concessions |
| External foundry demand | Repeat customer business beyond classification changes | Announcements without meaningful production revenue |
| Factory economics | Better unit costs as production scales | More volume without a credible path to profitability |
| Cash generation | Improving recurring cash flow after necessary investment | Repeated dependence on outside financing |
| Shareholder returns | Better sustainable earnings and cash flow per share | Capital needs growing faster than the benefit per share |
The MentorSurge take
The reasonable bull case is that product momentum and manufacturing progress eventually reinforce each other. The reasonable bear case is that the factories absorb too much capital before enough of that progress reaches shareholders.
I would judge the next report by which explanation gains evidence—not by whether management sounds confident or the stock had a strong week. Better business results deserve attention. Durable per-share economics deserve conviction. Keep the distinction clear, and the INTC debate becomes much more useful.
For more dated market analysis, explore the MentorSurge Markets library.
This article is educational and informational commentary, not personalized investment advice or a recommendation to buy or sell any security. It does not state a personal position in INTC. Company statements and expectations can change; review subsequent filings and current market data before making an investment decision.

Written by Joe | MentorSurge
Entrepreneur and market participant behind MentorSurge, sharing lessons shaped by trusted mentors, real experience, and continued study.